Carbon Intensity Dashboard as a MATLAB App
The National Grid have a fantastic website where you can view what they call the 'carbon intensity' of electricity in Great Britain, broken down by region, and with half-hourly forecasts for the next two days. While this on its own is pretty interesting (if, like me, you like large engineering systems and want to know more about your personal climate impact) it also comes with an API, designed for interacting with smart meters and other IoT devices to allow them to optimise their power use to when electricity is clean and cheap.
To this end, last month the company put out a press release hailing their new 'Green Light Signal', claiming a "world first" in producing a device that tells consumers when electricity is low-carbon by changing the light to green. The threshold for this is apparently "150 g of CO2/kWh", which on a UK scale is not too bad, especially given that as recently as 2012, the carbon intensity generally stayed between 400 and 700 g of CO2/kWh.
While this is certainly a first for a consumer device, last summer I was looking at the carbon intensity website and decided to browse the API documentation. While I'd never worked with an API before, it looked fairly straightforward, so I decided to have a play around.
MATLAB is rarely the best programming language for tasks outside of its normal engineering domain, but it's also the only one I know well enough to throw together something quickly. With that in mind, I decided to see if I could put together a function that could call the API and tell me what the local carbon intensity was.
%Testing calling the CarbonIntensity.org API

%----SETUP----
% Array containing the carbon index levels and the colours to which they
% correspond
indexColours = ["low","green";"medium","yellow";"high","orange";"very high","red"];


% Setting popup styles
popupStruct.Interpreter = 'tex';
popupStruct.WindowStyle = 'non-modal';
%----\SETUP----

% Calling the API
meanCI = webread('https://api.carbonintensity.org.uk/intensity');

% Extracting the carbon index from the API data
cIndex = meanCI.data.intensity.index;
% Selecting a text colour corresponding to the carbon index
intensityColour = indexColours(strcmp(indexColours,cIndex),2);
% Creating a LaTeX string of with the text in that colour
ciValue = num2str(meanCI.data.intensity.actual);

% Opening the popup with the coloured text
popup = msgbox(strcat("\FontSize{large}\color{",intensityColour,"}",cIndex,"{ }",ciValue),'Carbon Intensity Monitor',popupStruct);
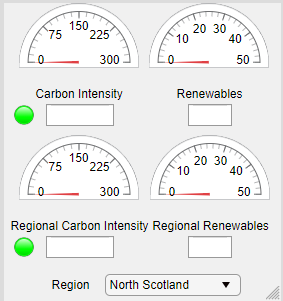
This was my first proper attempt at using the app designer tools in MATLAB, after a fairly brief look for coursework purposes in second year, when I decided marks were to be found more easily elsewhere. The drag-and-drop UI layout interface is simple enough, and I soon had a nice layout...
The programming side of apps is a little more involved, but not as bad as I first feared. Most of the code I had already made could sit in the
startupFcn section, just looping through every half hour to update the values
index.Colours = ["very low","#228c22";"low","#00ff00";"moderate","#ffff00";"high","#ffa500";"very high","#ff0000"];

while(1)
    % Calling API for Carbon Intencsity, g/kWh for current half-hour
    CI = webread('https://api.carbonintensity.org.uk/intensity');
    % Calling API for Nation Grid generation mix for currrent
    % half-hour
    gridMix = webread('https://api.carbonintensity.org.uk/generation');

    % Putting the current carbon intensity on the gauge
    app.CarbonIntensityGauge.Value = CI.data.intensity.actual;
    app.CarbonIntensityField.Value = strcat(num2str(CI.data.intensity.actual),' g/kWh');

    % Setting the correct colour for the intensity lamp
    app.IndexLamp.Color = index.Colours(strcmp(index.Colours,CI.data.intensity.index),2);

    % Extracting renewables data to their own structures
    hydro = gridMix.data.generationmix(7);
    solar = gridMix.data.generationmix(8);
    wind = gridMix.data.generationmix(9);

    % Summing renewable % and sending to gauge
    app.RenewablesGauge.Value = solar.perc + wind.perc + hydro.perc;
    % Converting % to string, sending to text panel
    app.RenewPerc.Value = strcat(num2str(app.RenewablesGauge.Value),' %');
    pause(1800)
end
Getting the renewables to add correctly took a little bit of work, but overall this is still pretty straightforward, and tells us a lot more about the carbon intensity than a single on-off green light can.
This definitely isn't the best way to build something like this - for one thing it freezes up MATLAB continuously while the dashboard is running, which is unhelpful - and I'm sure a much better desktop applet could be made in some other language, but as a quick tool for learning to use APIs, it did its job very well. I had vague thoughts about getting this to run in Python on a Raspberry Pi, which could then use its IO to control some LEDs or even an LCD display showing the desired data, or switching devices on and off, but time constraints (and the impossibility of getting hobby electronics delivered in 2020) put that on hold. It might well be something I pick up later.
Full install code for the app here in case you want to have a go with it. No guarantees it will keep working for long - things built on other people's APIs (and on a frequently-updated language like MATLAB) rarely stay fully-functional without maintenance.
Have any thoughts about this post? Use the contact page to get in touch.

